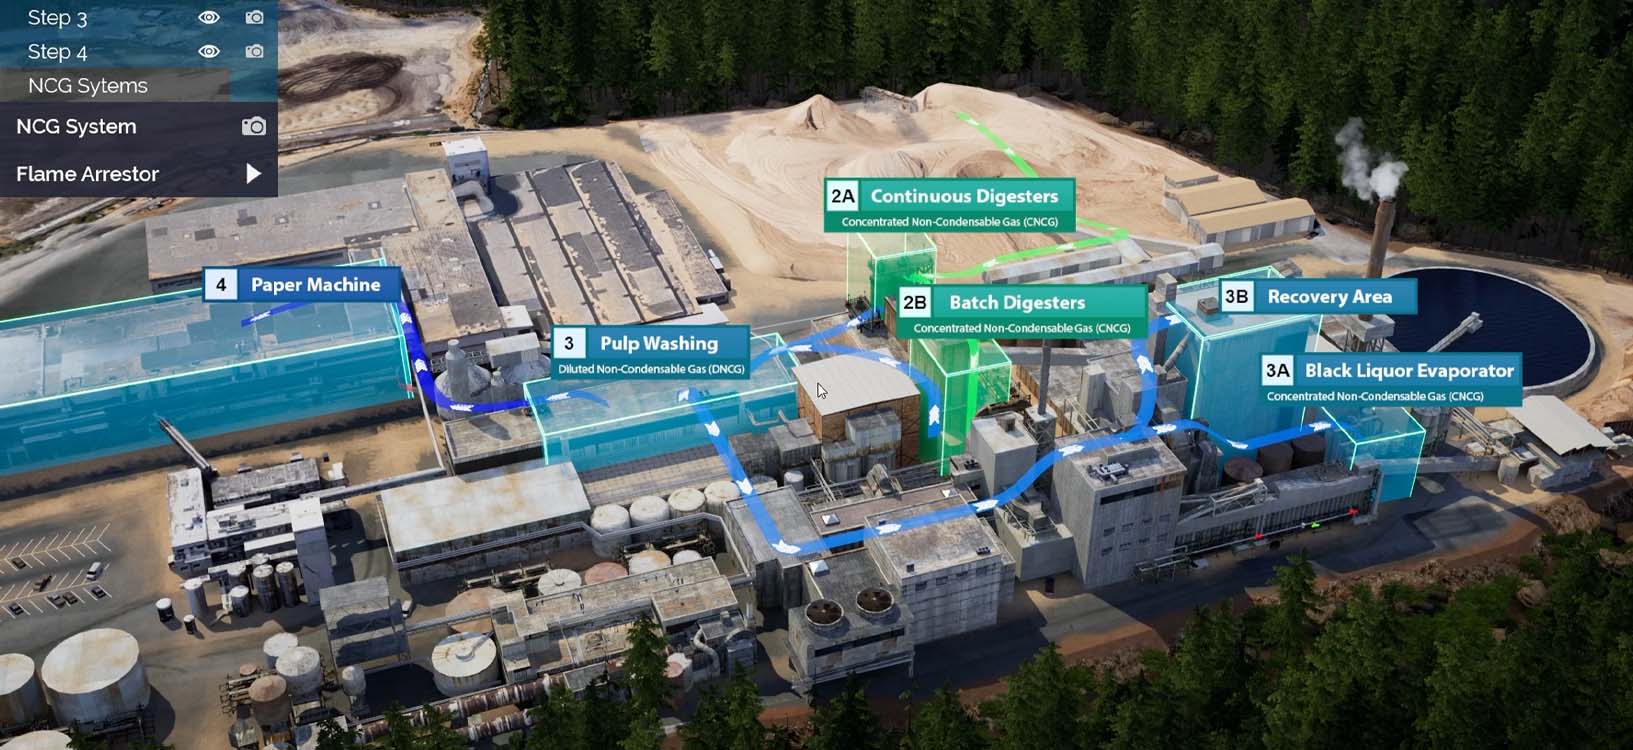
Rotate, zoom, and move through the scene at will. Jump instantly between important moments, trigger animations on demand, and pull up photos, diagrams, and documents right in the experience. See it in action: Investigate a drainage culvert obstructed by a telephone pole, uncovering every detail of the blockage and its impact.
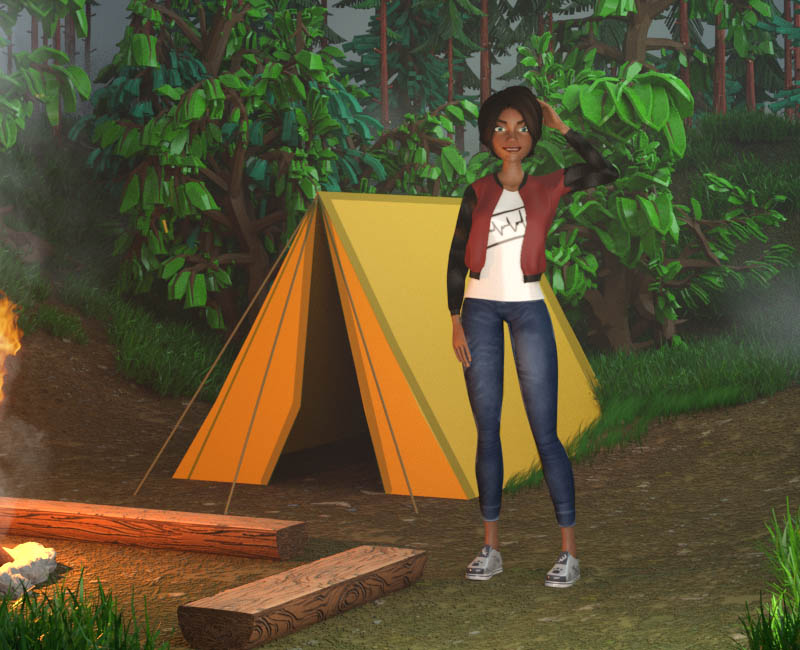
View PortfolioInteract with a detailed 3D vehicle model to test alternative outcomes. Compare real events against safer possibilities such as stopping at the proper point instead of navigating a high-speed curve. Rotate views, adjust perspectives, replay sequences, and review evidence to clearly demonstrate how different decisions could have prevented the accident.
Organize complex data into an intuitive interactive map with a built-in timeline slider. Explore events as they unfold over time, zoom into specific locations, jump between key moments, and instantly access supporting photos, reports, and documents.
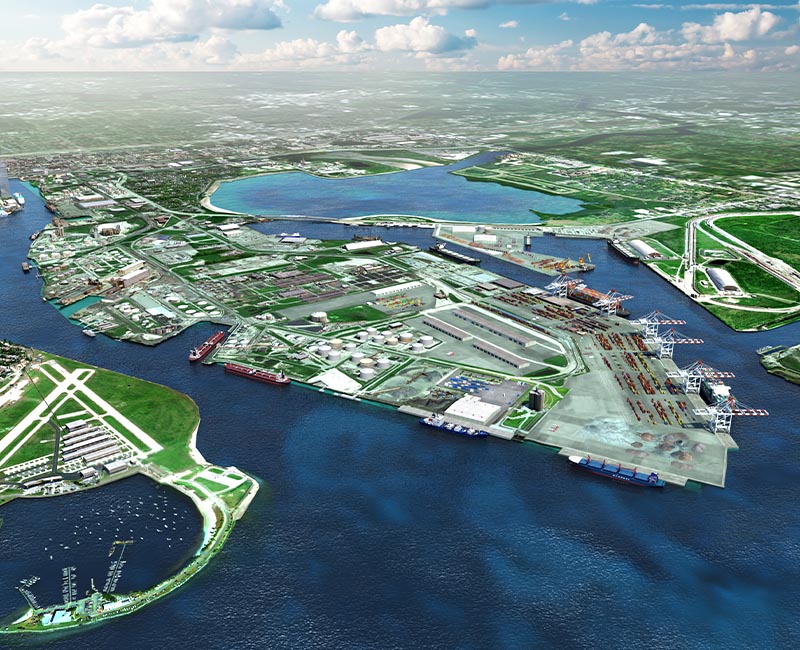
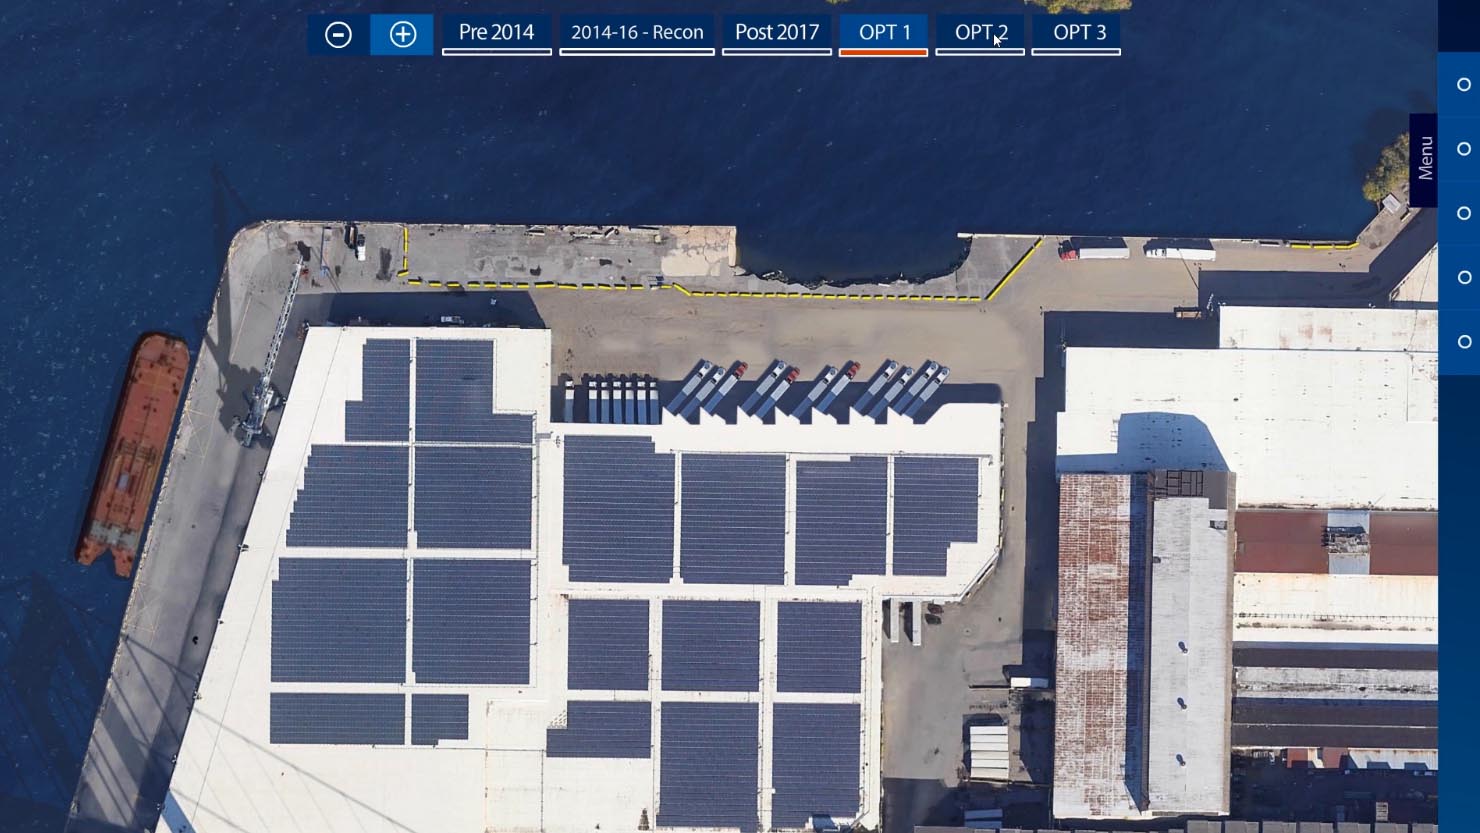
Examine side-by-side 3D models of highway designs see the original plan versus what was actually constructed. Use time snapshots to view traffic flow evolution, switch between views, zoom into discrepancies, and access supporting documents for a clear understanding of impacts on safety, capacity, and performance.
Sometimes seeing how a network of people connects can be challenging to explain. We put together an interactive spiderweb diagram allowing connections to be isolated and seen with ease.
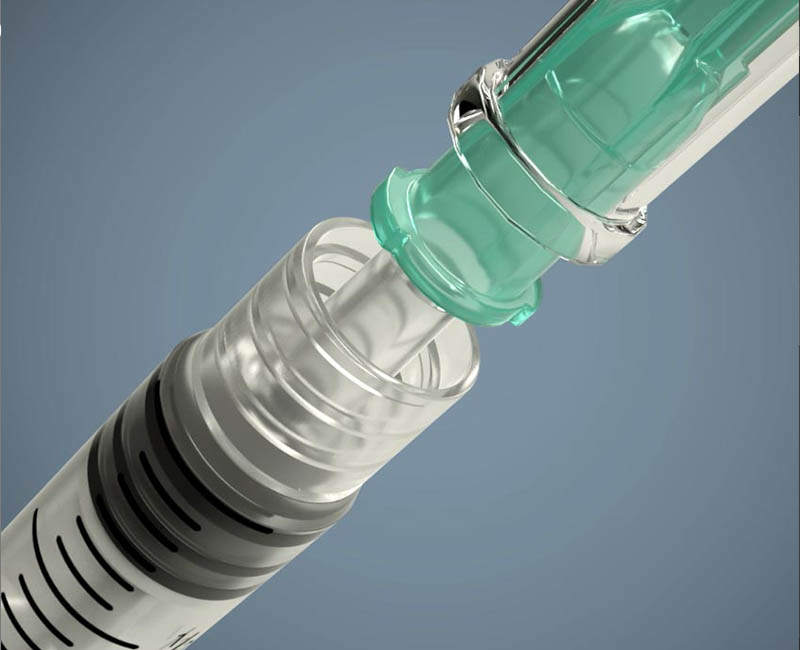
This interactive allows the user to show the house's modification with the ability to overlay the type of construction and quickly view the before and after state.
When all the roads started having issues in this subdivision, they needed to show not only the real damages but the locations and explanation of how it occurred. With this exhibit, all the information was consolidated into an easy to use interface.
We created this interactive to manage and visualize years of data across hundreds of different companies, drugs, and measurements. The result was a robust graphing tool that included an interactive timeline and animated presentations.
View Portfolio